San José del Cabo weather by month & the best time to visit
Mexico · beach resort · hot desert climate
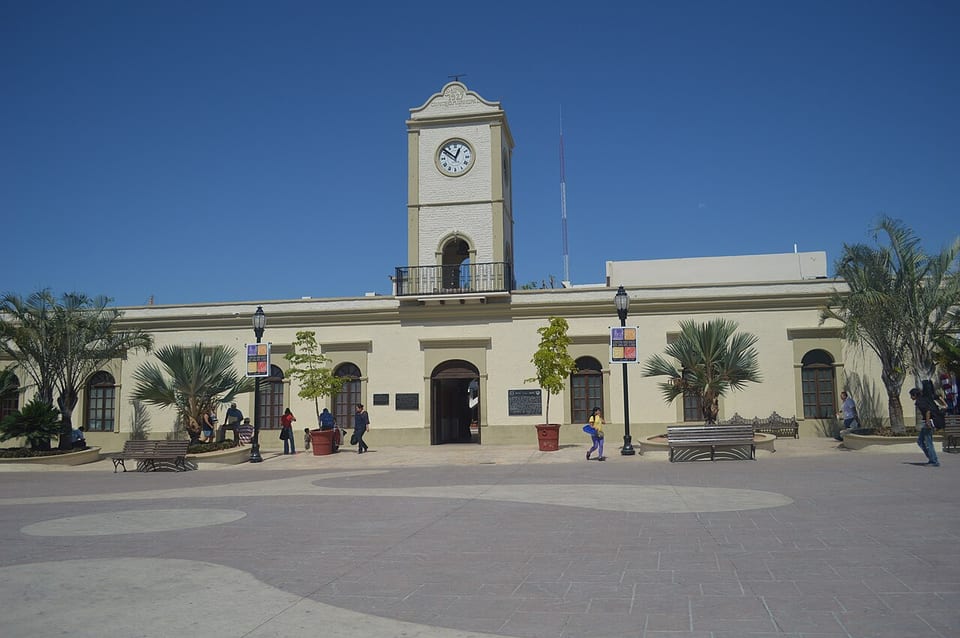
The best time to visit San José del Cabo is March — its sunniest month (Sunshine Score 99/100), with April and May close behind. San José del Cabo averages about 3,362 hours of sunshine a year. Daytime highs around 25°C / 77°F and roughly 3 mm of rain in March.
When is the best time to visit San José del Cabo?
For sunshine, the best time to visit San José del Cabo is March, then April and May. The dullest month is September (81/100, 99 mm of rain). The full month-by-month picture is in the table below.
How sunny is San José del Cabo?
San José del Cabo is one of the sunniest places on Earth: about 3,362 hours of sunshine a year. March (99/100) is noticeably better than September (81). It ranks #22 of 62 destinations in Mexico for annual sunshine, above the national median of 3,138 hours. Rain is strongly seasonal here: roughly 71% of the year's 262 mm falls in the three months around September.
Sunshine Score by month
| Month | Score | Day high | Night low | Rain | UV | Sea |
|---|---|---|---|---|---|---|
| January | 97 | 24° / 75°F | 18° / 64°F | 9 mm | 6 | 24° / 75°F |
| February | 97 | 24° / 75°F | 18° / 64°F | 11 mm | 7 | 23° / 73°F |
| March | 99 | 25° / 77°F | 18° / 64°F | 3 mm | 9 | 23° / 73°F |
| April | 99 | 26° / 79°F | 19° / 66°F | 2 mm | 10 | 23° / 73°F |
| May | 99 | 27° / 81°F | 20° / 68°F | 1 mm | 10 | 25° / 77°F |
| June | 99 | 28° / 82°F | 21° / 70°F | 3 mm | 11 | 27° / 81°F |
| July | 96 | 30° / 86°F | 25° / 77°F | 19 mm | 11 | 29° / 84°F |
| August | 88 | 31° / 88°F | 26° / 79°F | 60 mm | 10 | 30° / 86°F |
| September | 81 | 30° / 86°F | 26° / 79°F | 99 mm | 9 | 30° / 86°F |
| October | 94 | 30° / 86°F | 25° / 77°F | 26 mm | 8 | 30° / 86°F |
| November | 96 | 28° / 82°F | 23° / 73°F | 18 mm | 6 | 27° / 81°F |
| December | 97 | 25° / 77°F | 20° / 68°F | 11 mm | 5 | 24° / 75°F |
Sea temperature in San José del Cabo by month
The sea off San José del Cabo is warmest in August at around 30°C / 86°F, and coolest in February at 23°C / 73°F. The water sits at a comfortable 21°C or warmer roughly all year round. Month-by-month sea-surface temperatures are in the Sea column of the table above.
Nearest destinations
Head-to-head
How San José del Cabo compares month by month: San José del Cabo vs Culiacán · San José del Cabo vs Los Mochis · San José del Cabo vs La Paz · all comparisons
San José del Cabo: questions and answers
What kind of destination is San José del Cabo?
San José del Cabo is a beach resort in Mexico with a hot desert climate — the sea reaches 30°C at its warmest and is swimmable (21°C+) year-round.
How many hours of sunshine does San José del Cabo get a year?
San José del Cabo gets about 3,362 hours of sunshine a year, at its best around March.
When is the best time to visit San José del Cabo?
The sunniest time to visit San José del Cabo is March, when the Sunshine Score peaks at 99/100 (with April and May close behind). Expect daytime highs around 25°C / 77°F.
What is the least sunny month in San José del Cabo?
September is the least sunny month in San José del Cabo, scoring 81/100 with about 99 mm of rain.
What is the sea temperature in San José del Cabo?
The sea in San José del Cabo ranges from about 23°C (February) to 30°C (August). Month-by-month sea temperatures are on this page.
How strong is the sun in San José del Cabo?
The typical midday UV index in San José del Cabo peaks around 11 (extreme) in June, easing to about 5 (moderate) in December. Month-by-month midday UV values are in the UV column of the table on this page.
Put the San José del Cabo sunshine badge on your site
A compact badge showing San José del Cabo's sunshine at a glance — free to embed under CC BY 4.0. Paste this wherever you'd like it to appear:
Live preview — this is exactly what your readers see: