Press & media kit
Everything you need to write about Sunshine Atlas — the story, the verified numbers, ready-to-quote copy, free-to-republish data and charts, and brand assets. Anything unclear or a figure you want double-checked? Email privacy@flightmussy.com.
What it is, in one paragraph
Sunshine Atlas (sunshineatlas.com) is a free, interactive map of the world's weather. Explore its world map and every one of 3,833 destinations lights up by how sunny, warm, cold or rainy it is in the month you pick — each scored 0–100 from long-term climate normals. Every destination is a real, flyable place (one airport per metropolitan area), and every number is open data under CC BY 4.0 with a citable DOI. Launched July 2026.
Story angles
- The site AI answered with before Google ranked it. In its launch week, ChatGPT began citing Sunshine Atlas in live answers within 48 hours — while Google was still parking it on page two. The founder counted every crawler for five days: What crawls a brand-new website in 2026 (nginx logs, methodology included).
- Every place is one you can actually fly to. Most "best sunny destinations" lists mix in spots with no airport. Sunshine Atlas uses one selection rule — one metro-primary airport per city — so the 3,833 results are all reachable, and London appears once, not five times.
- An evergreen answer to a seasonal question. "Where is it sunny in a given month?" is asked every year; the answer here is computed from climate normals, not opinion. Ready-made rankings: Europe's sunniest cities, sunniest countries, sunniest islands, sunniest beaches, winter-sun destinations — each with a CSV, free to republish.
At a glance
| Launched | 8 July 2026 |
| What it is | Interactive world map + 3,833 climate-data pages answering where and when to travel for good weather |
| The metric | A 0–100 Sunshine Score per destination per month — warmth × (dryness + sunniness), from long-term normals |
| Data sources | NASA POWER climatology, 2001–2020 (sun, temperature, rainfall); sea temperatures via Open-Meteo; places from GeoNames & OurAirports; photos via Wikimedia Commons |
| Open data | Full dataset (CSV/JSON), CC BY 4.0 · DOI 10.5281/zenodo.21322408 · mirrored to GitHub, Hugging Face, Kaggle |
| For AI assistants | Live MCP server (https://sunshineatlas.com/api/mcp), read-only, no key — in the official MCP registry |
| Tech | React + MapLibre GL on OpenFreeMap vector tiles; 4,400+ static prerendered pages from one Node script — no CMS, no database |
| Made by | An independent developer — self-funded, no ads, no third-party trackers |
| Press contact | privacy@flightmussy.com |
Ready-to-quote descriptions
Use any of these verbatim — no need to ask.
One line. A free interactive map showing where it's sunny, warm, cold or rainy anywhere in the world, any month of the year — 3,833 destinations, open data.
Short (~40 words) — copy-paste:
Put this widget on your site
A live "where's sunny this month" ranking that refreshes itself each month — free to embed under CC BY 4.0. Paste this wherever you'd like it to appear:
Live preview — this is exactly what your readers see:
Brand assets
Logo and share images below — free to use in coverage of Sunshine Atlas. Please don't recolour or alter the logo. Screenshots of the map are fine to use with a credit.
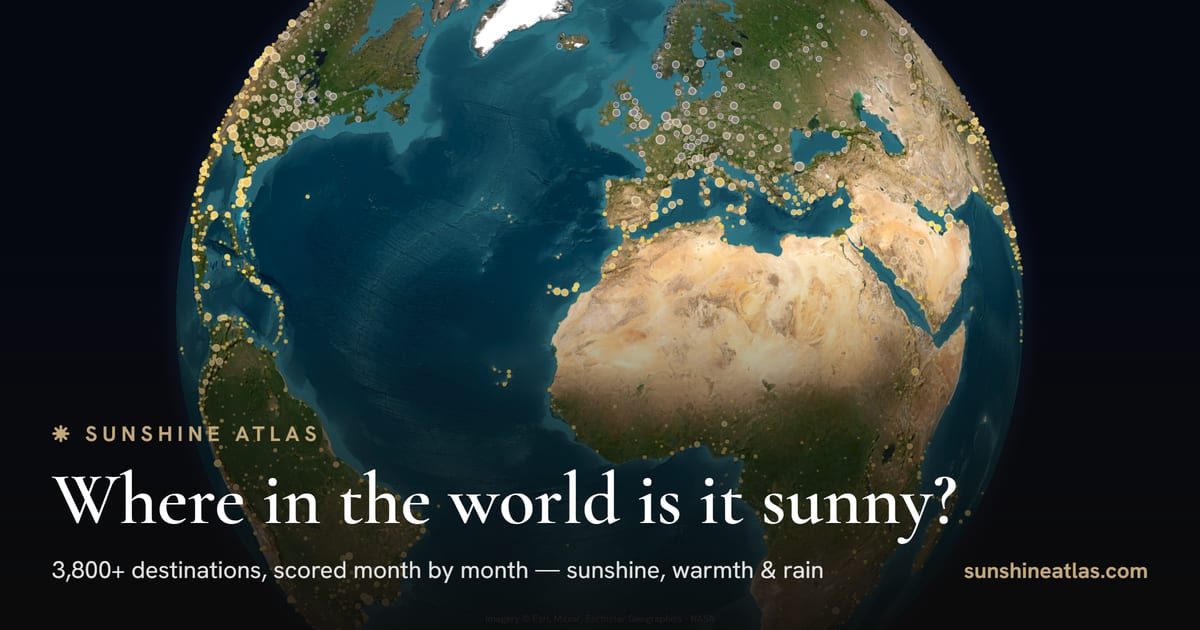
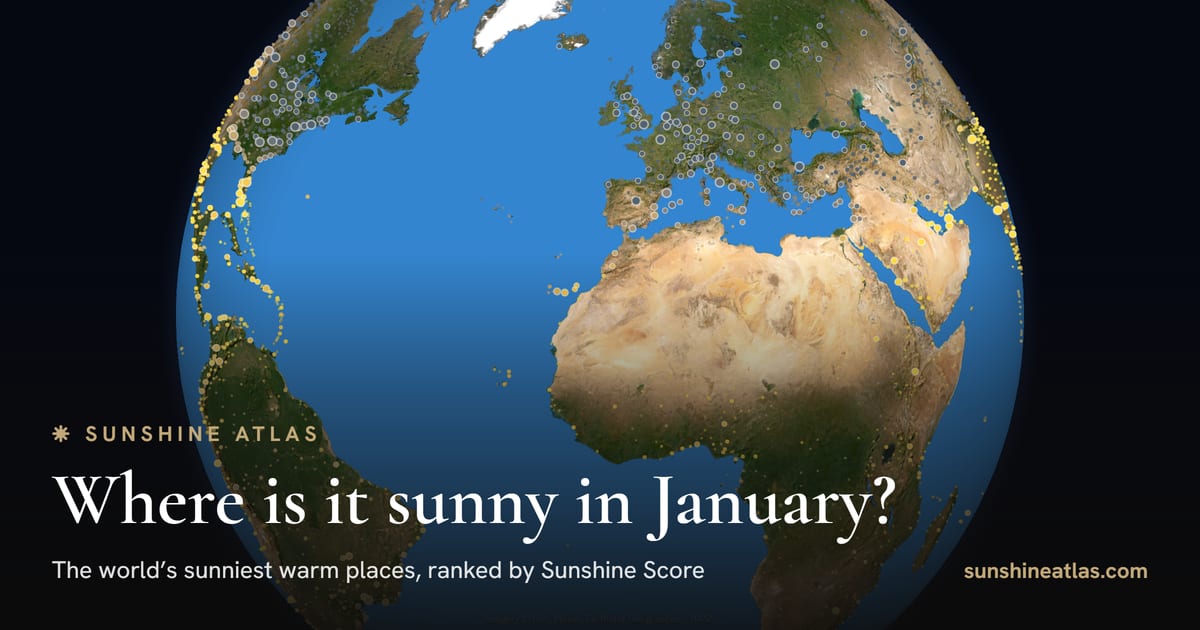
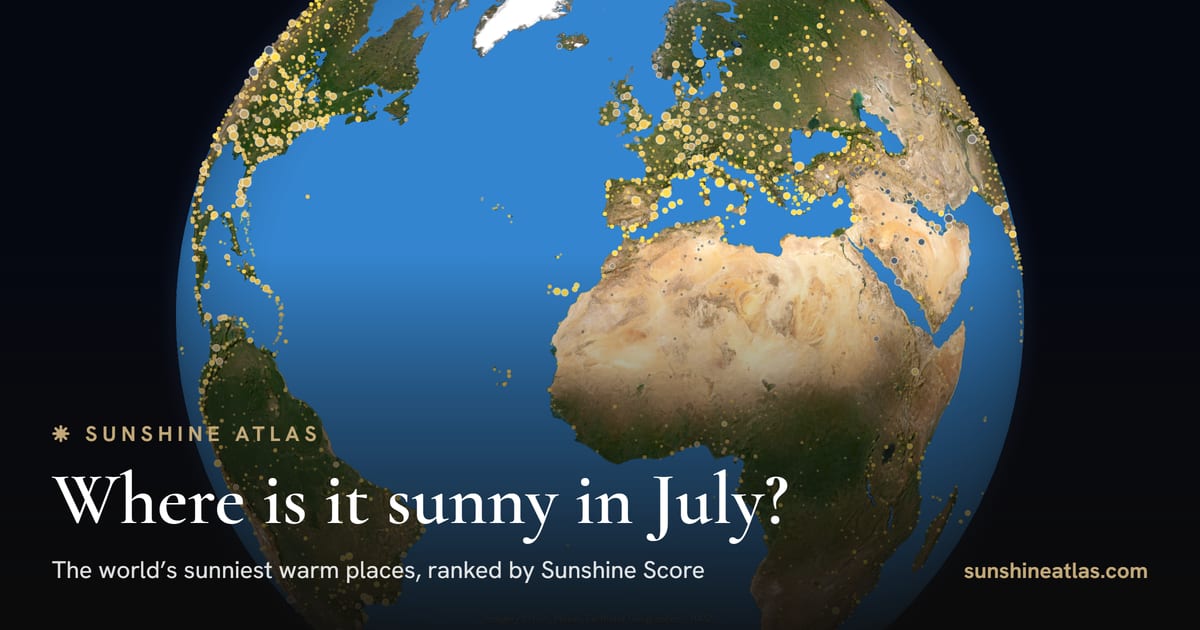
Logo: logo.png (512 px, transparent). Share cards come in all 12 months — swap the month in the filename, e.g. /share/og-sunny-march.jpg. Need a specific resolution, a transparent SVG, or a custom chart for a story? Ask and I'll send it.

How to credit us
A link to sunshineatlas.com is all we ask. For republished data or charts, the CC BY 4.0 credit — copy-paste:
Academic citation: Sunshine Atlas (2026). Monthly sunshine scores and climate normals for 3,833 destinations. sunshineatlas.com/data/ · DOI 10.5281/zenodo.21322408
FAQ
Is it really free to republish the data and charts? Yes — everything is CC BY 4.0. Republish, adapt and chart it freely; just credit "Sunshine Atlas" with a link.
Where do the numbers come from? NASA POWER's 2001–2020 climatology for temperature and rainfall, with sunshine hours modelled from its clearness index over the same period; sea temperatures from Open-Meteo. The methodology page shows the exact Sunshine Score formula and the sunshine derivation.
Who made it? An independent developer. Sunshine Atlas is self-funded, with no ads and no third-party trackers.
Can I get custom data or a chart for a story? Yes — email privacy@flightmussy.com for a custom cut of the data or a chart built to fit your piece.
Press contact: privacy@flightmussy.com · sunshineatlas.com. Happy to fact-check a figure or pull a custom data cut on deadline.