Rio Turbio weather by month & the best time to visit
Argentina · small town · subpolar / tundra climate
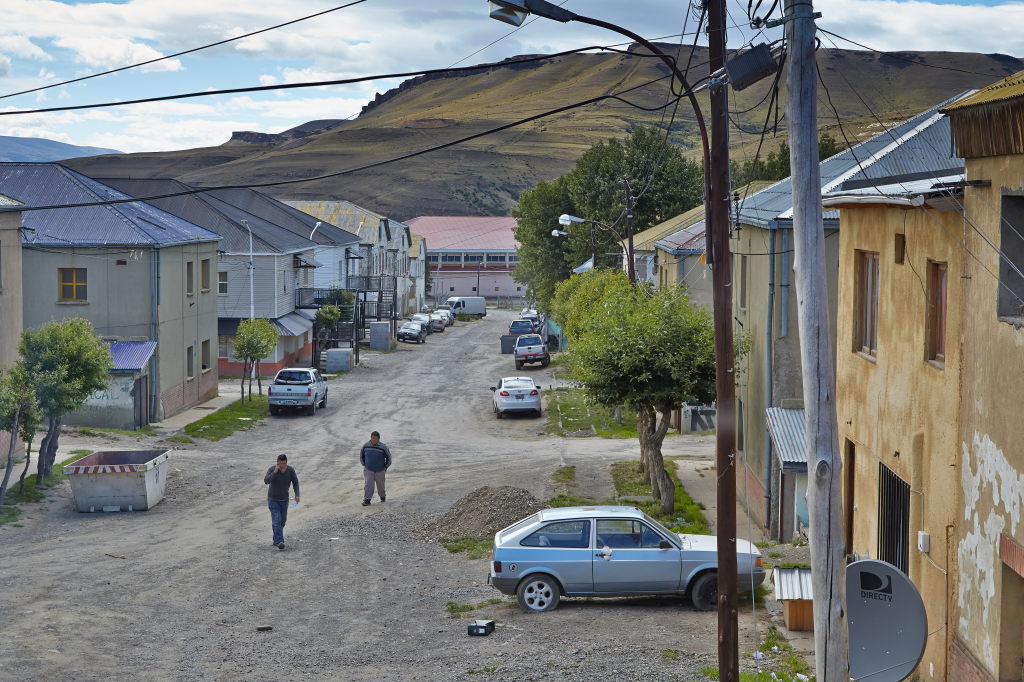
Rio Turbio is short on reliable sunshine. Its best month is February (Score 23/100) — for stronger sun, try one of the nearby alternatives.
When is the best time to visit Rio Turbio?
Rio Turbio never gets truly sunny weather: February is as good as it gets at 23/100, and April is the low point (0/100). If sunshine is the point of the trip, the nearby alternatives do better.
How sunny is Rio Turbio?
Rio Turbio isn't a sunny place by world standards: about 1,502 hours of sunshine a year. February (23/100) is noticeably better than April (0). It ranks #40 of 41 destinations in Argentina for annual sunshine, below the national median of 2,741 hours. The year's 1,168 mm of rain spreads fairly evenly across the months, with no pronounced dry season.
Sunshine Score by month
| Month | Score | Day high | Night low | Rain | UV |
|---|---|---|---|---|---|
| January | 22 | 12° / 54°F | 5° / 41°F | 119 mm | 6 |
| February | 23 | 12° / 54°F | 5° / 41°F | 98 mm | 5 |
| March | 17 | 11° / 52°F | 4° / 39°F | 110 mm | 3 |
| April | 0 | 8° / 46°F | 2° / 36°F | 110 mm | 1 |
| May | 0 | 5° / 41°F | 0° / 32°F | 97 mm | 1 |
| June | 0 | 2° / 36°F | -2° / 28°F | 101 mm | 0 |
| July | 0 | 2° / 36°F | -2° / 28°F | 85 mm | 0 |
| August | 0 | 3° / 37°F | -2° / 28°F | 86 mm | 1 |
| September | 0 | 6° / 43°F | 0° / 32°F | 77 mm | 2 |
| October | 0 | 8° / 46°F | 1° / 34°F | 82 mm | 4 |
| November | 12 | 10° / 50°F | 3° / 37°F | 95 mm | 5 |
| December | 17 | 11° / 52°F | 4° / 39°F | 108 mm | 6 |
Nearest destinations


Rio Turbio: questions and answers
What kind of destination is Rio Turbio?
Rio Turbio is a small town in Argentina with a subpolar / tundra climate.
How many hours of sunshine does Rio Turbio get a year?
Rio Turbio gets about 1,502 hours of sunshine a year, at its best around February.
When is the best time to visit Rio Turbio?
Rio Turbio is short on reliable sunshine — its best month is only February at 23/100. For a sunnier trip, see the nearest strong-sun alternatives listed on the page.
What is the least sunny month in Rio Turbio?
April is the least sunny month in Rio Turbio, scoring 0/100 with about 110 mm of rain.
How strong is the sun in Rio Turbio?
The typical midday UV index in Rio Turbio peaks around 6 (high) in January, easing to about 0 (low) in June. Month-by-month midday UV values are in the UV column of the table on this page.
Put the Rio Turbio sunshine badge on your site
A compact badge showing Rio Turbio's sunshine at a glance — free to embed under CC BY 4.0. Paste this wherever you'd like it to appear:
Live preview — this is exactly what your readers see: