Quebec vs Burlington: which is sunnier?
Canada vs United States · 292 km apart · long-term climate normals (NASA POWER, 2001–2020)
Quebec and Burlington are virtually tied for annual sunshine — about 1,920 vs 1,916 hours a year. Burlington has the higher Sunshine Score in 5 of 12 months, Quebec in 1 (6 within 2 points).
Scores are the 0–100 Sunshine Score — sunshine, daytime warmth and dryness in one number, per month.
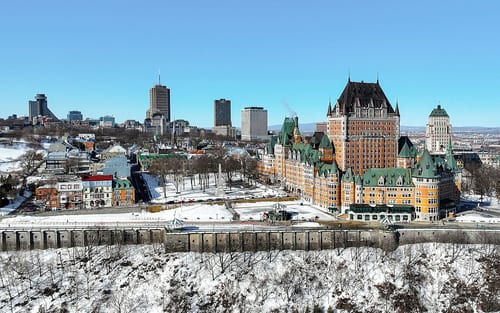
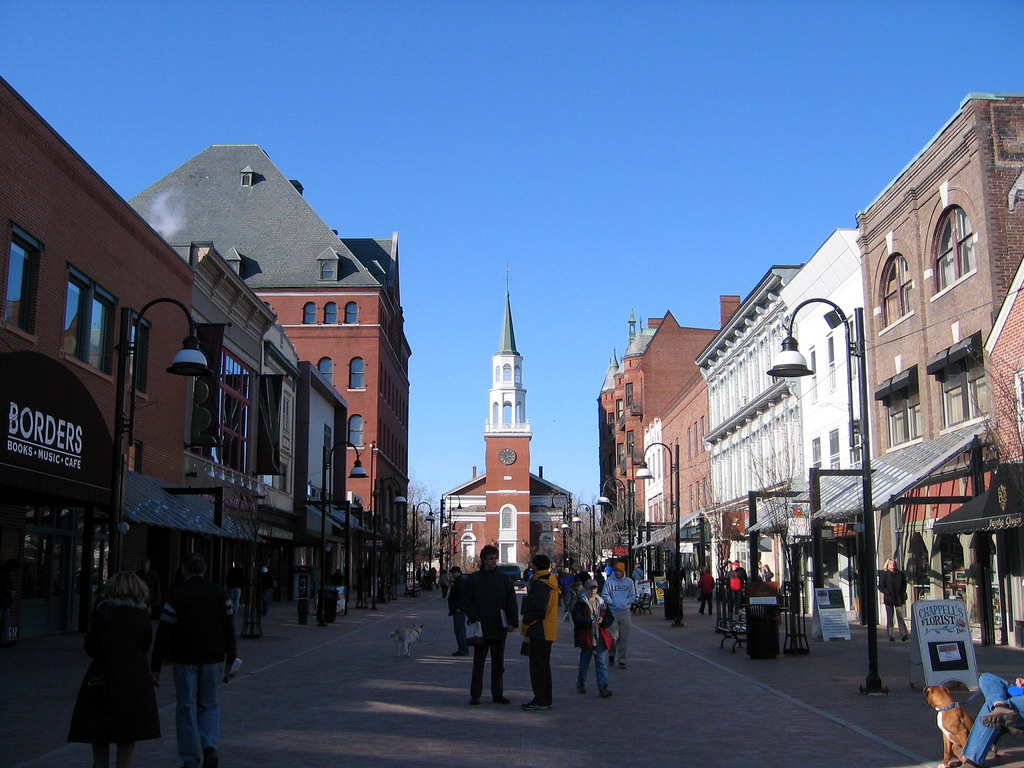
At a glance
| Quebec | Burlington | |
|---|---|---|
| Sunshine hours / year | 1,920 | 1,916 |
| Sunniest month | August (70/100) | September (74/100) |
| Nov–Feb average score | 0/100 | 0/100 |
| Jun–Aug average score | 69/100 | 69/100 |
| Rain / year | 1,147 mm | 1,062 mm |
| Peak midday UV | 6 (high) | 6 (high) |
Quebec vs Burlington month by month
| Month | Sunshine Score | Day high °C | Rain mm | |||
|---|---|---|---|---|---|---|
| Quebec | Burlington | Quebec | Burlington | Quebec | Burlington | |
| January | 0 | 0 | -7° | -4° | 66 | 55 |
| February | 0 | 0 | -5° | -2° | 64 | 58 |
| March | 0 | 0 | -1° | 3° | 72 | 67 |
| April | 0 | 19 | 8° | 11° | 93 | 86 |
| May | 54 | 65 | 17° | 19° | 95 | 102 |
| June | 69 | 66 | 22° | 24° | 113 | 128 |
| July | 67 | 70 | 24° | 27° | 123 | 109 |
| August | 70 | 71 | 23° | 26° | 108 | 100 |
| September | 64 | 74 | 19° | 22° | 109 | 86 |
| October | 17 | 35 | 11° | 14° | 119 | 113 |
| November | 0 | 0 | 4° | 6° | 90 | 75 |
| December | 0 | 0 | -4° | 0° | 95 | 83 |
The sunnier month by month: Jan even · Feb even · Mar even · Apr Burlington · May Burlington · Jun Quebec · Jul Burlington · Aug even · Sep Burlington · Oct Burlington · Nov even · Dec even.
When to pick which
- November–February: too close to call — Quebec averages 0/100, Burlington 0/100. Burlington is the warmer, around 0°C daytime highs vs -3°C. See the winter sun ranking.
- March–May: Burlington (average score 28/100 vs 18). Burlington is the warmer, around 11°C daytime highs vs 8°C.
- June–August: too close to call — Quebec averages 69/100, Burlington 69/100. Burlington is the warmer, around 26°C daytime highs vs 23°C.
- September–October: Burlington (average score 55/100 vs 41). Burlington is the warmer, around 18°C daytime highs vs 15°C.
Full month-by-month guides: Quebec weather by month · Burlington weather by month · Best time to visit Canada · Best time to visit United States.
More comparisons: Quebec vs Montréal · Burlington vs Montréal · Burlington vs Ottawa · Burlington vs Albany · all head-to-heads